Credit: Nina L/peopleimages.com - Adobe Stock
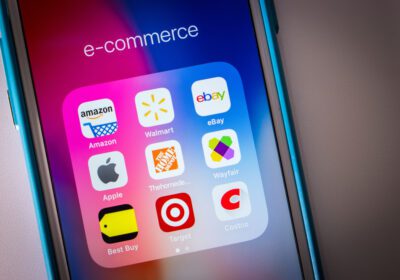
Ecommerce Category Statistics & Trends
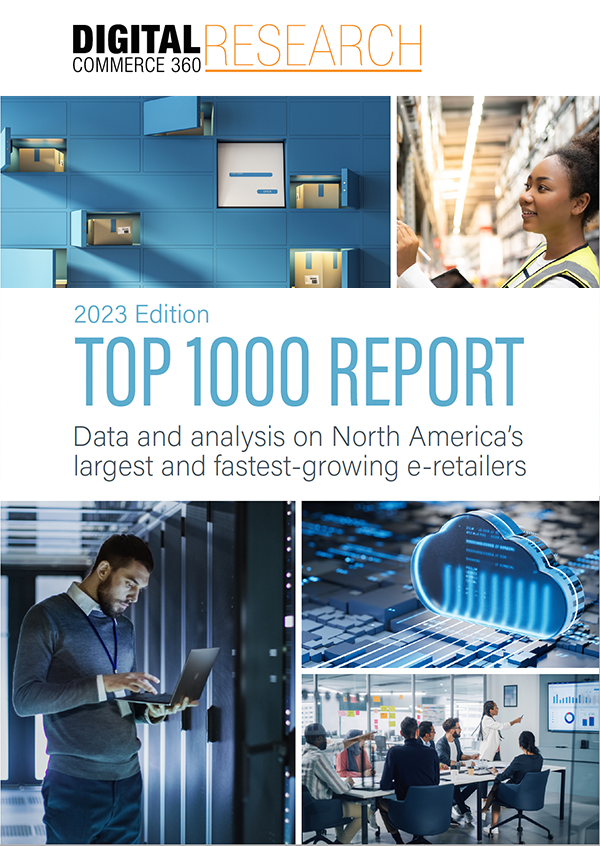
Each year Digital Commerce 360 breaks down the leading online retailers by region and category. Here are the leading ecommerce trends on each of the 14 online categories Digital Commerce 360 tracks.
Ecommerce Category Breakdowns
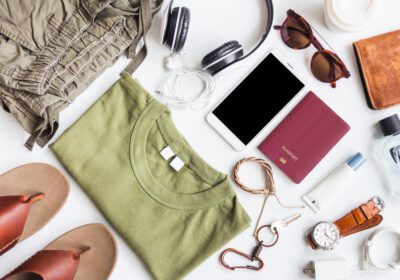
Apparel & Accessories
Ecommerce Statistics + Trends
Automotive Parts & Accessories
Ecommerce Statistics + Trends

Consumer Electronics
Ecommerce Statistics + Trends
Flowers & Gifts
Ecommerce Statistics + Trends

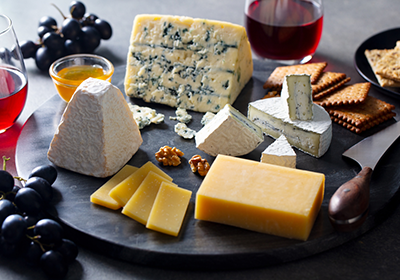
Food & Beverage
Ecommerce Statistics + Trends
Hardware & Home Improvement
Ecommerce Statistics + Trends

Health & Beauty
Ecommerce Statistics + Trends

Houseware & Home Furnishings
Ecommerce Statistics + Trends

Jewelry
Ecommerce Statistics + Trends

Mass Merchant
Ecommerce Statistics + Trends
Office Supplies
Ecommerce Statistics + Trends

Specialty
Ecommerce Statistics + Trends
Sporting Goods
Ecommerce Statistics + Trends
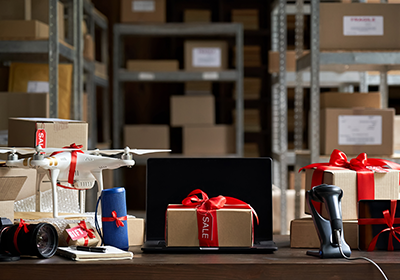
Toys & Hobbies
Ecommerce Statistics + Trends

KEY MERCHANDISE CATEGORY TAKEAWAYS FROM TOP 1000 ECOMMERCE DATA
Key Takeaways:
Ecommerce Charts & Data