
Credit: TCG Empire press release
TOYS/HOBBIES

 |
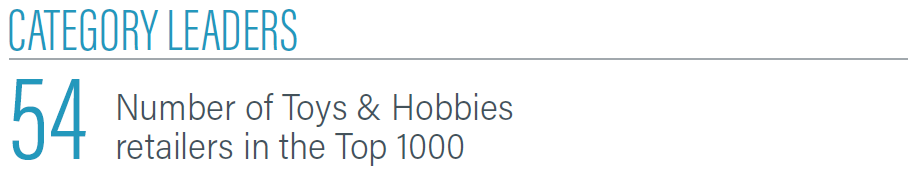
Top 1000 retailers in the Toys & Hobbies category reached $13.98 billion in sales in 2023. That’s 19.3% growth from $11.29 billion the prior year.
Moreover, online sales from Top 1000 retailers in the Toys & Hobbies category accounted for 65.3% of the entire category’s sales in the United States (at physical stores and online), according to the Department of Commerce. That share grew in 2023 from 51.5% in 2022.
Under the hobbies subsection are retailers that sell collectibles, arts and crafts supplies, musical instruments, video games and more.
 |
|

The U.S. Department of Commerce revealed that Toys & Hobbies retailers in the country sold $21.91 billion in 2022 — online and offline. That fell up 2.3% in 2022 to $21.41 billion. Despite the overall decline, Top 1000 retailers in the Toys & Hobbies category grew online sales in the year.
The median monthly unique visitor count increased among Toys & Hobbies retailers in the Top 1000, to about 821,000 from about 432,000. The median when it came to average order value barely grew, to $188 from $187. This implies that although the dollar value of sales went up, much of it came from inflated prices or big spenders.

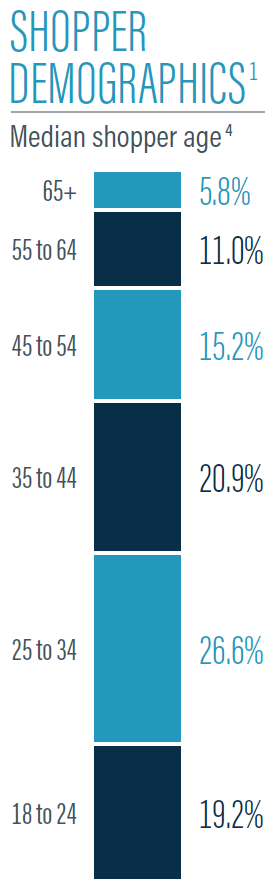
When it comes to age groups, the largest subset of buyers from the Top 1000’s Toys & Hobbies category were 25 to 34. Nearly a quarter of all the category’s buyers (26.6%) were in that age group. The next largest was the 35-44 age group, coming in at 20.9%. Those 18-24 accounted for 19.2% of sales.
The remaining age groups were largely consistent with each other. Those 45 to 54 were at 15.2%. It was the two oldest demographic that had less than 15% of sales each coming in at 11.0% for ages 55 to 64 and 5.8% for those 65+.
 |
 |
Source: Digital Commerce 360 1. Digital Commerce 360 analysis of SimilarWeb traffic data. 2. Includes only U.S. sales from the sites of U.S.-owned retailers for consistency with the U.S. Department of Commerce’s methodology. 3. Digital Commerce 360 analysis of U.S. Department of Commerce retail data. 4. Medians won’t sum to 100%.
Toys & Hobbies News Feed