
Jana Podpleska, content marketing specialist, MonkeyData
Today, we’re going to be doing a review of our old friend, Google Analytics. Now, I know you’re all familiar, but I wanted to take some time today to go through the advantages and drawbacks of Google Analytics—what it’s great for, and where it comes up a bit short.
I first started using Google Analytics as an analyst at a music technology startup in Montréal. Keep in mind, I’m not a super technical guy, so at times some things could be rather frustrating. However, Google Analytics is a very powerful tool if you know how to yield it properly. Let me walk you through my experience with Google Analytics and how you can use it to boost your business.
The Advantages
Cost
First off, it’s free. [Editor’s note: The free version requires a retailer to share its data with Google. There is a premium version with added features designed for larger websites.] For an analytical tool that can do so much, that’s great. Nothing more I need to say on this.
It’s basically the gold standard of analytics
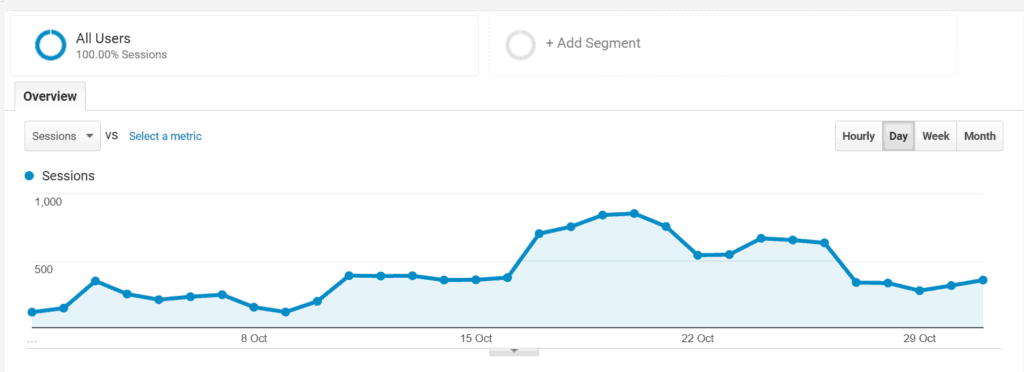
Google Analytics has almost every metric you would want to analyze. You can look at your bounce rate, average time spent on page, etc. You can even look at the specific performance of each page. In addition to this, you can segment your data by whatever segment you want—what campaign they came from, which traffic source, what sort of behavior they exhibited on your website. Just go to your main dashboard and hit on “Add Segment”…
Then, you’ll be taken to this screen below, where you create your segment. Just choose whatever campaign/behavior etc. you want to split by and create your segment.
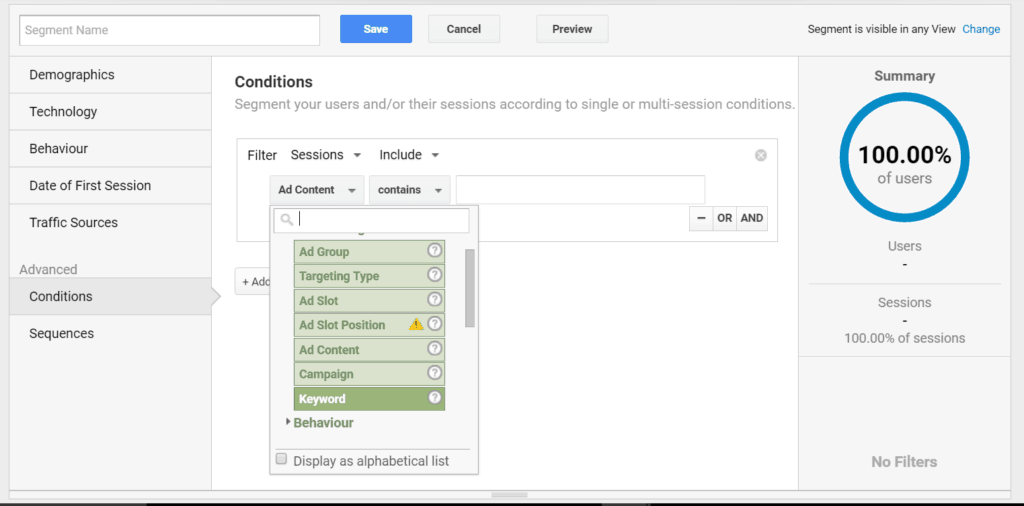
This level of granularity will help you get more useful views of your data. You can view the performance of specific campaigns, keywords, etc. In my experience, high level data is often not very useful and it often takes granularity to find anything insightful. This feature in Google Analytics will help you do this.
Goals and conversion rates
I’m putting these two together because they’re highly related to one another.
A goal is simply an action that you want your visitors to take, whether that be completing a lead form, signing up for a newsletter, downloading an e-book or actually making a purchase. There are several goal types that you can set up, including URL destination goals, visit duration goals, pages/visit goals and specific event goals. You can find more about how to set up these different goal types here.
You can then look at the conversion rate for each of your goals in the “Conversions” section of your Google Analytics dashboard. Drop down the “Goals” menu and click on “Overview”.
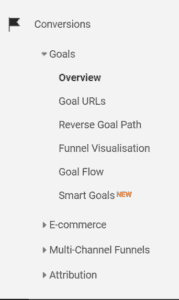
This will show you the conversion rate for each of the goals you set up. Like I explained above, you can create a segment in this section to look at the success of specific campaigns.
Drawbacks
Yes, despite how great it is, Google Analytics does have some drawbacks. Nothing is ever perfect, and I want to highlight some things that might be difficult for you if you are going to start using (or just want to get deeper into) Google Analytics.
Can be difficult to fully utilize without strong technical knowledge
As is often the case with any complicated software, Google Analytics can be difficult to use without technical knowledge.
Creating events is one particular thing that less technical store owners may have a problem with. It requires you to add a JavaScript snippet to your website for each goal in order to be able to do this. For a guide on how to do this, check out this article.
Since your goals are based on events, and you will certainly want to track events on your website within Google Analytics, this is one particular skill that you will want to master, but again, is something that makes Google Analytics difficult to work with at times.
Not 100% accurate with high traffic
Google Analytics does this thing called “sampling” when you have so much traffic that it can’t give you completely accurate data. It will always warn you when it’s doing sampling, and you can adjust the amount of data taken in the sample by using the slider on the right-hand side of this image.
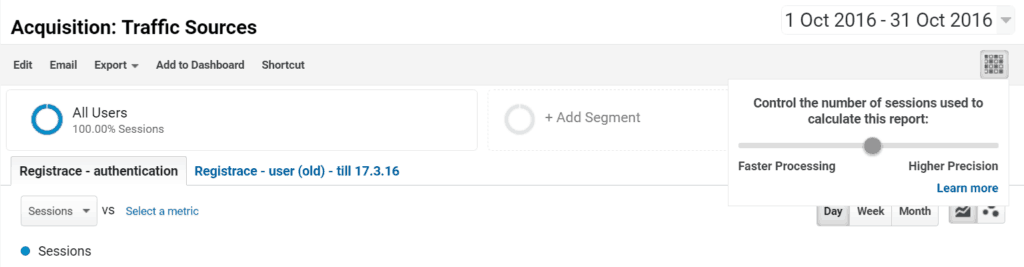
However, there are some instances where Google Analytics will not allow you to crank up the sample to 100%, since you have so much traffic.
There are some ways around this. You can shorten the time period you are looking at to allow yourself to have a 100% sample. However, I have found when doing this, you will get different results if you take a 100% sample of the same time period two different times. Be careful with it.
The main takeaway from this is that you shouldn’t be using Google Analytics data for anything that needs to be absolutely 100% accurate (like accounting figures). If you want something 100% accurate, you will likely have to use a back-end database solution. Granted, having an 80% sample of 100,000 users in Google Analytics is going to give you a pretty good idea of what’s going on. Just bear in mind that it won’t have 100% hair-splitting accuracy.
Cannot look up unique user IDs
Due to privacy concerns, you cannot look up unique user identifiers in Google Analytics. So, if you want to link your PayPal or Intercom customer data to Google Analytics, you aren’t going to be able to. This means you have to limit yourself to the events and goals that you have set up in Google Analytics, and the segmentations that it will allow you. Not the end of the world, but if you want to get very granular with you data, it will prevent you from doing certain things.
Doesn’t show you all data sources in one place
Although Google Analytics has many great features, it is simply only one of your data sources (granted, possibly the most important). If you want to do a full reporting on all your online ads, for example, and you have ads on Facebook, AdWords and Twitter, you will have to go to each of those individual sources and look up your spend and cost per click in each channel. This can be very time-consuming. However, there are certain apps that can consolidate your data sources for you and prevent you from having to waste your time checking each data source individually.
Conclusion
Google Analytics is a fantastic tool, there’s no doubt about that. However, after working it for a while, I have realized that there are a few things that can make it frustrating at times. This is by no means a comprehensive list, but rather a summary of the most common issues that have blocked me from getting the most out of the tool. Just be aware of these limitations, and what you can do to get around them. That will help you save your time and will also help you to get the most out of your data.
Based in the Czech Republic, MonkeyData provides analytics technology for online retailers and brands.
Favorite