
Credit: Sundry Photography - Adobe Stock
APPAREL/ACCESSORIES
 |
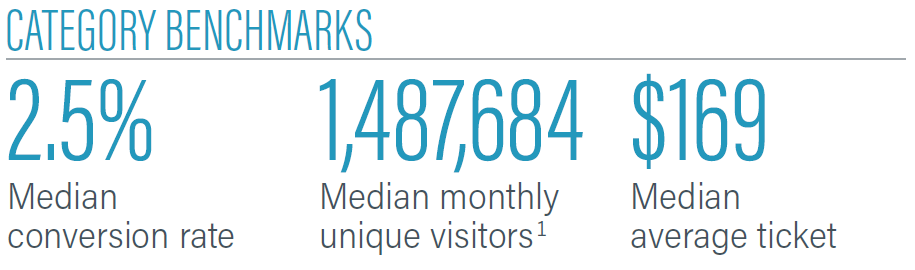
Online sales for Apparel & Accessories retailers increased in 2023. Median conversion rate decreased to 2.5% in 2023, from 2.7% in 2022. Median monthly unique visitors reached 1,487,684, a 60% increase compared with 899,644 in 2022.
The median average ticket increased 9% year over year reaching $169 in 2023, compared with $157 a year earlier. That’s higher than the 3.4% inflation rate year over year in December 2023.
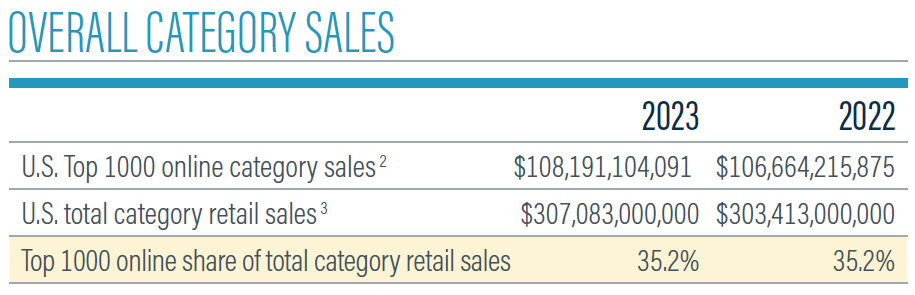
Online sales among the Top 1000 Apparel & Accessories merchants increased to $108.19 billion in 2023. Those sales comprised 35.2% of the total combined in-store and online sales in the category. Online sales increased less than 2% in 2023, up from $106.66 billion in 2023.
The top five retailers in the category held their places in 2023. Nike Inc. grew 1.0% in 2023, down from 20.8% growth in 2022. Fanatics Inc. grew 46.0% in 2023. The rest of the top five retailers fell behind with a drop in web sales. Macy’s Inc. sales decreased 5.5%, The Gap Inc. online sales dropped 7.0%, followed by Nordstrom Inc. (-10.7%) in 2023.
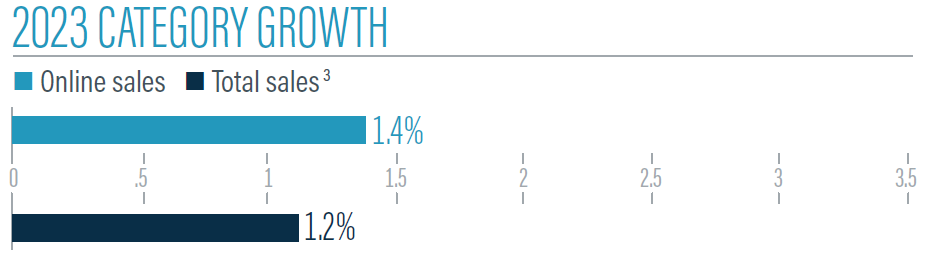
Apparel & Accessories merchant online sales grew 1.4% in 2023, above the growth rate of total U.S. retail sales in the category at 1.2%, according to a Digital Commerce 360 analysis of U.S. Department of Commerce retail data.
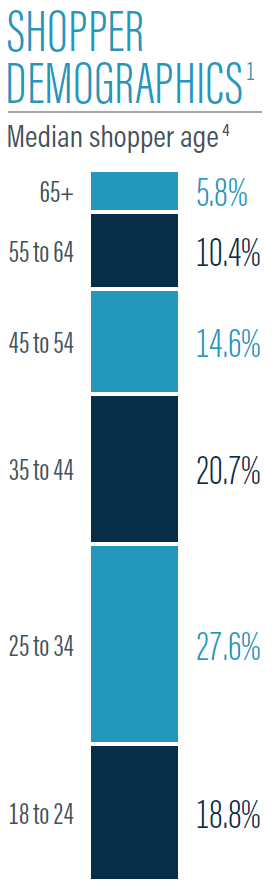
The median shopper age shows that shoppers in the 25-to-34 age range still make up the largest group of shoppers at 27.6% in 2023 compared with 27.4% in 2022.
The median age breakdown of Apparel & Accessories shoppers likely to purchase online is similar to the overall Top 1000 (25.1%). 20.7% of Apparel & Accessories shoppers are adults ages 35-44, compared with 18.4% of Top 1000 shoppers in that age group. No one age demographic dominates with a majority of online sales in the category.
 |
Source: Digital Commerce 360 1. Digital Commerce 360 analysis of SimilarWeb traffic data. 2. Includes only U.S. sales from the sites of U.S.-owned retailers for consistency with the U.S. Department of Commerce’s methodology. 3. DigitalCommerce360 category estimate, the U.S. Department of Commerce doesn’t break out the jewelry segment, which is a different category in the Top 1000 4. Medians won’t sum to 100%.
Apparel/Accessories Category News Feed