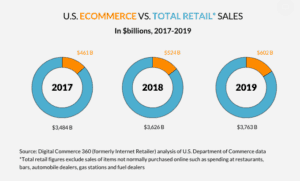
Consumers spent $601.75 billion online with U.S. merchants in 2019, up 14.9% from $523.64 billion the prior year, according to the U.S. Department of Commerce quarterly ecommerce figures released Wednesday. That was a higher growth rate than 2018, when online sales reported by the Commerce Department rose 13.6% year over year.
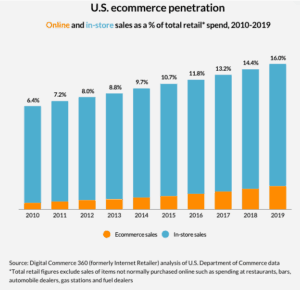
Online’s share of total retail sales has steadily been on the rise—with ecommerce penetration hitting 16.0% in 2019, according to a Digital Commerce (formerly Internet Retailer) analysis of the Commerce Department’s year-end retail data. That was up from 14.4% in 2018 and 13.2% in 2017. The growth in penetration was the biggest annual percentage point jump at least since 2000, the first full year the department began tracking ecommerce spending.
Total retail sales increased 3.8% in 2019 to $3.763 trillion from $3.626 trillion the year before, according to Digital Commerce estimates using Commerce Department figures. The performance of overall retail last year marked a slight slowdown from 2018, when sales through all channels jumped 4.1%. Digital Commerce 360 studies non-seasonally adjusted Commerce Department data and excludes sales of items not normally purchased online such as spending at restaurants, bars, automobile dealers, gas stations and fuel dealers.
Ecommerce also accounted for more than half—56.9%—of all gains in the retail market last year. That’s the largest share of growth for online spending since 2008, when ecommerce represented 63.8% of all sales growth. Plus, this is only the third time in the history of U.S. retail that the year-over-year dollar gains for online purchases exceeded the gains for in-store spending in a given year.
Q4’s online growth bounces back from 2018 but slows from Q3
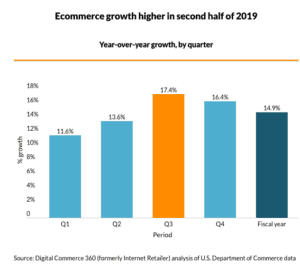
In the fourth quarter of 2019, U.S. ecommerce sales reached $187.25 billion, up 16.4% year over year from $160.89 billion in 2018. Q4 fared much better in 2019 than the same period in 2018, when online sales rose just 10.8%. That was the second lowest rate for the quarter ever, behind a 6.1% decline in Q4 2008.
Despite the recovery, last year’s Q4 growth was a deceleration from the 17.3% uptick in the third quarter of 2019. Growth in the latter half of 2019 was significantly higher than the year-over-year online sales growth registered in the first six months of the year, when ecommerce increased 11.6% in Q1 and jumped 13.6% in Q2. The third quarter’s rate also marked the highest quarterly growth since Q4 2011, when online revenue spiked 18.6% over the same period the previous year.
Ecommerce penetration hit 18.0% in the fourth quarter of 2019, marking online’s highest ever recorded share of total retail sales. That compared with 16.1% for the same period during the prior year. Growth in digital sales also accounted for nearly two-thirds—65.2%—of all retail gains in Q4, up from 52.2% a year earlier.
When factoring out Digital Commerce 360’s excluded categories, total retail sales in Q4 experienced the same trends. The fourth quarter had a 4.1% boost in overall retail spend to $1.038 trillion from $998.04 billion in 2018—a slower year-over-year growth than 4.8% in Q3 2019 but a better showing than Q4 2018, when total retail increased only 3.1%.
Amazon’s continuing domination of ecommerce sales
Amazon.com Inc., No. 1 in the 2019 Digital Commerce 360 Top 1000, continues to dominate in ecommerce, growing market share to the chagrin of its competitors. The total value of transactions on Amazon.com in the U.S. grew 25.3% to reach $221.95 billion in 2019 from $177.10 billion the previous year, according to Digital Commerce 360’s early estimates of Amazon’s gross merchandise value. This includes sales of Amazon’s own products and items sold by third-party marketplace sellers.
This would mean Amazon alone represented more than a third—36.9%—of all U.S. ecommerce last year. Additionally, the web behemoth accounted for more than half—57.4%—of ecommerce growth and nearly a third—32.7%—of total retail gains through all sales channels.
Top ecommerce stories from 2019
To help bring the numbers into focus and better understand the ecommerce landscape for the year, it’s worth a look back at the big headlines in retail in 2019.
French luxury giant LVMH (No. 20) bought jeweler Tiffany & Co. (No. 179), fast-fashion chain Forever 21 (No. 115) filed for bankruptcy before staging a comeback, and established beauty brands snapped up DNVBs to appeal to young, hip shoppers. Plus, omnichannel programs had a big year, Nike (No. 33) ditched Amazon, and web-only retailers saw the value of physical stores.
For more on retail shake-ups—including bankruptcies and acquisitions—major news and trends that emerged last year, read 2019’s year in review.


