
Credit: Rafael Henrique - Adobe Stock
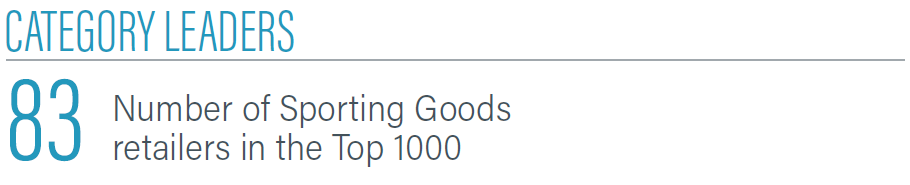
Sporting Goods
 |
Sales from the 83 Sporting Goods retailers in the Top 1000 slightly decreased in 2023 at $22.60 billion. They sold $387 million less than 2022.
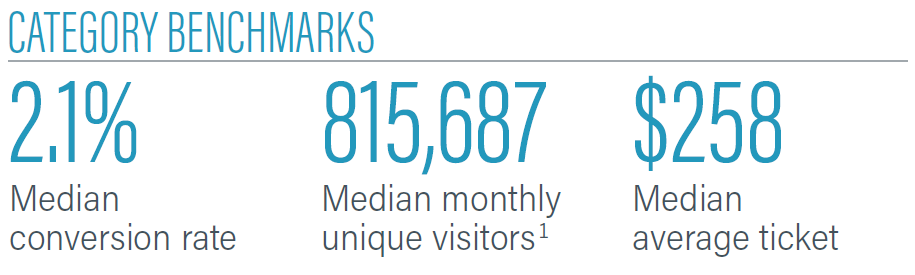
Sporting Goods retailers decreased to 2.1% in 2023 from 2.3% median conversion rate in 2022. They also decreased the median average ticket to $258 from $261. Those aged 25-34 bought the most from Top 1000 Sporting Goods retailers in 2023.
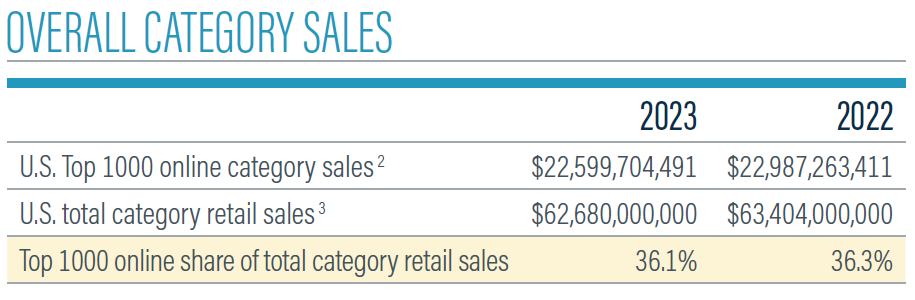
The share of Top 1000 sales from Sporting Good retailers dipped slightly in 2023 — to 36.1% from 36.3% in 2022. Total sporting good sales in the U.S. (at physical stores and online) also dipped to $62.68 billion in 2023 from $63.40 billion in 2022. So U.S. Sporting Goods sales fell both online and in physical stores in 2022.
The median monthly unique visitor count grew among Sporting Goods retailers in the Top 1000, to about 815,000 from about 504,000.
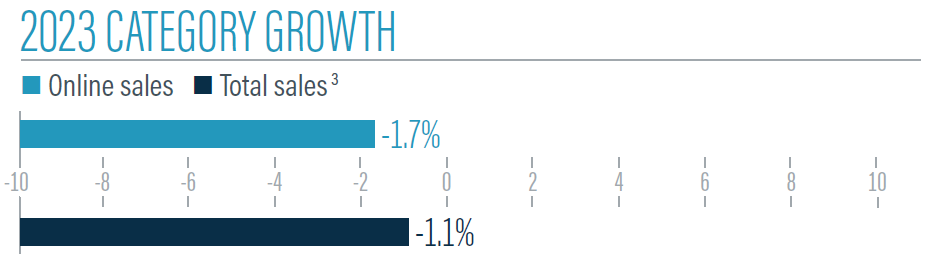
Sales declined in the Sporting Goods category, and they declined more online (1.7% year over year) than they did at physical stores. Total sales (online and offline) declined just 1.1% for the category.
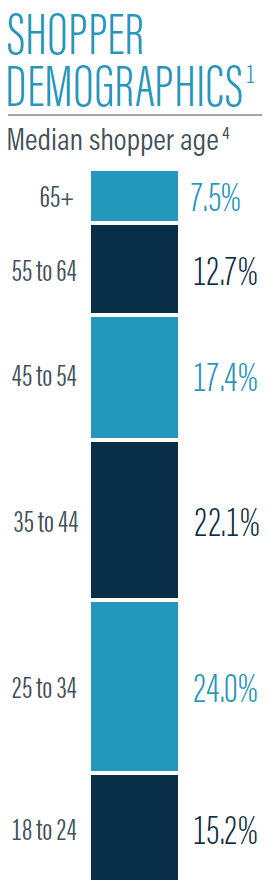
Shoppers ages 25-34 buy more from Top 1000 Sporting Goods than other age groups. However, the sales split by age group doesn’t vary too much. The youngest (18-24) and oldest (65+) buy Sporting Goods products the least (15.2% and 7.5%, respectively). Starting with the 25-34 age group, data shows shoppers buy less and less from Top 1000 Sporting Goods retailers as they get older.
Those 35-44 accounted for 22.1% of the Top 1000 category’s sales, and those 45-54 accounted for 17.4%. Shoppers ages 55-64 accounted for 12.7% of the category’s sales.
 |
 |
Source: Digital Commerce 360 1. Digital Commerce 360 analysis of SimilarWeb traffic data. 2. Includes only U.S. sales from the sites of U.S.-owned retailers for consistency with the U.S. Department of Commerce’s methodology. 3. Digital Commerce 360 analysis of U.S. Department of Commerce retail data. 4. Medians won’t sum to 100%
Sporting Goods Category News Feed