


Chris Wraight, director of industry marketing, Akamai.
Predicting and preparing for peak traffic volume and resource demands is a difficult task for online retailers around the world. They need to be ready for both expected and unexpected traffic spikes at any time. No one wants the CEO on their doorstep asking why their website is down and losing revenue every second it remains offline.
In this post, we’ll review key web performance insights that Akamai saw globally in the 2018 holiday shopping season, including:
- The continued rise of mobile
- Who the mobile customer is
- Conversion and bounce rates
In the next post, we’ll discuss the security challenges we observed and share critical recommendations to retailers for peak traffic in 2019.
Web Performance
In order for retailers to plan for peak traffic, offer an optimal customer experience (CX) and convert visits to revenue, it’s key that they have a system in place that monitors and evaluates global traffic activity throughout the year.
Akamai recently analyzed seven global holidays in late 2018 for key metrics related to digital experience, of which web and mobile performance is a big part. This involved reviewing statistics such as the number of sessions, devices and mobile OS being used, conversion rates as well as security threats.
For our data set, we evaluated online retail traffic from around the world that touched nearly 100 retail websites and mobile retail apps, providing Akamai with more than 5 billion daily data points that we assessed in aggregate. The baseline was the daily average session traffic for periods preceding a holiday that varied for each holiday. Note that Diwali (the Hindu festival of lights, celebrated every autumn in October or November) is not a single shopping day but a weeklong period of shopping, which explains why its numbers were so much higher than all the other holidays, which are single-day events.

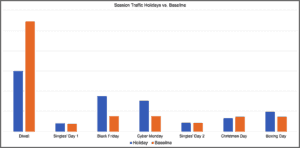
For many of the holidays, the majority of online shopping occurs prior to the actual holiday, especially if the holiday is longstanding and originated for purposes other than shopping. Diwali and Christmas Day are prime examples of these types of days where the holiday is spent visiting with family and friends, rather than shopping.
Other ‘holidays’, such as Singles’ Day (1 & 2, the world’s largest online shopping event), Black Friday and Cyber Monday were designed entirely for shopping and promotion purposes. Boxing Day, although much older than any of these known shopping holidays, is more in line with the above than Diwali or Christmas Day, and echoes their metrics as well.
Desktop vs. Mobile Devices
The late comedian George Carlin had a famous routine featuring Al Sleet, “the hippy dippy weatherman.” In the skit, Al’s prediction was, “Weather forecast for tonight dark, continued dark overnight, with widely scattered light by morning.”
Like Al’s forecast, prognostication about mobile devices being used more in online shopping is probably the easiest prediction to make. Industry pundits and vendors alike were comfortable making this prediction about the 2018 holiday shopping season. And, it came true! But let’s go further and examine the impact that the dominant use of mobile devices is having on retailers and what they should do to offer an optimal mobile CX going forward.
Akamai made the prediction in September 2018 that mobile shopping would continue its growth this holiday shopping season. And over the course of the seven major holidays, it did, as the chart below shows:

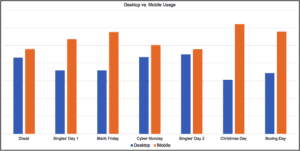

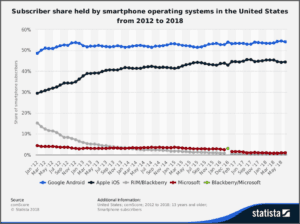
For the entire period, iOS users made up a larger percentage of mobile device users than Android users. This was an interesting statistic because globally, Android has approximately four times as many users as iOS, as seen in the next chart.

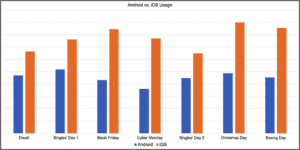

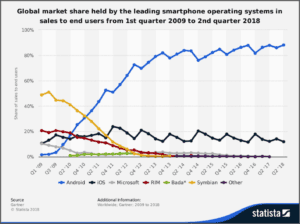
In the U.S., the next chart shows that the gap between Android and iOS is much smaller but Android users still outnumber iOS users. This could be due to the persona differences between Android and iOS users as we’ll see in the next section.
What About Converting Shoppers to Buyers?
Conversion Rates
While insights about the device and OS that visitors are using is helpful to application developers designing experiences, the proverbial “rubber meets the road” metric of visitor conversion rate is the key for retailers.

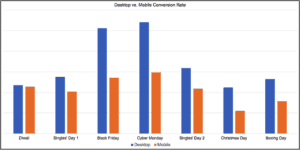
The chart above clearly shows how many more desktop users than mobile users converted to a purchase. This isn’t really a surprise, since traditionally, mobile conversions are about half those of desktop. Statistics from Q3 2018 also support this:
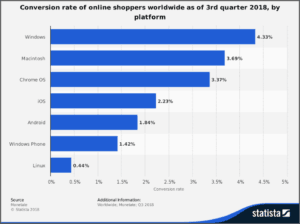
Some of this is due to historic usage (smartphones have only been around for ten years, but also due to applications not being optimized for mobile users. According to the comScore Mobile Hierarchy report, some specific reasons include:

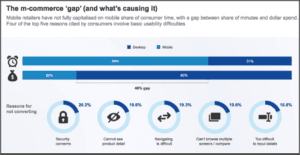
These reasons for not converting underscore the importance of providing an optimal mobile CX for visitors, as the use of mobile devices continues to grow beyond simple research to actual purchasing. And additional research drives home the point: “just 33 percent of survey respondents said they prefer to make purchases on mobile smartphones, and 49 percent said that buying via tablet and desktop offer a more frictionless experience.”
Closely related is the actual conversion rate of Android users versus iOS users. Here we clearly see that iOS users were more likely to make a purchase, reflecting the greater number of iOS users over Android. But why were iOS users more inclined to purchase than Android users?
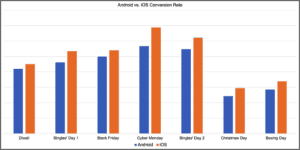
This recent surveyprovides some socio-economic rationale for the higher iOS conversion rate:
- iPhone owners tend to have higher incomes and spend more on technology than Android users
- Slickdeals reports, “iPhone Users Spend $101 Every Month on Tech Purchases, Nearly Double of Android Users”
- iPhone owners are generally happier than Android users, the survey found, and have greater spending power
- These users (iPhone) reported spending an average of $117 a month on clothes, compared to $62 a month for Android owners
- Android owners say they’re more frugal and inclined to frequently seek out deals and discounts
All of this data makes the higher iOS conversion rates plausible and underlines how important it is to incorporate Real User Monitoring (RUM) metrics into application development to ensure that, in addition to being optimized for mobile users, applications are developed for both mobile environments.
Bounce Rates
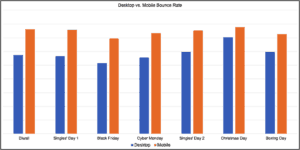
Bounce rates are another important metric to measure and evaluate. The higher mobile bounce rates can be attributed to the fact that many sites are not optimized for mobile visitors, and factors that were outlined above regarding why mobile conversion rates are historically lower than desktop come into play.
For example, the comScore Mobile Hierarchy pointed to “Cannot see product detail”as a key reason mobile shoppers were not converting. An eMarketer survey included three key things:
- “Item received does not look like the photo online (34 percent)”relates to both the quality/accuracy of the images as well as the number of images (so a shopper can get an accurate view of the product from all angles)
- “Low quality images of the product (16 percent)”refers to the image quality (pixelation) as well its suitability for the device (large, desktop images don’t ‘work’ on a smartphone)
- “Pages load slowly (13 percent)”speaks to the short attention span of users.
In an Internet Retailer post, some key research was included that emphasizes how important page load time is (but isn’t the only metric to consider):
- The mobile bounce rate was lowest (38.24 percent) at page load times just over 1.5 seconds during the 2017 holiday shopping season. Contrast this with a 44.28 percent bounce rate at a 3-second page load time
- Site visitors spend a mere 59 seconds or less on a web page on average according to the Nielsen Norman Group
The visual component to a positive mobile CX is extremely important, and in addition to static images, the increasing use of video also needs to be taken into consideration to help decrease bounce rates and boost conversion.

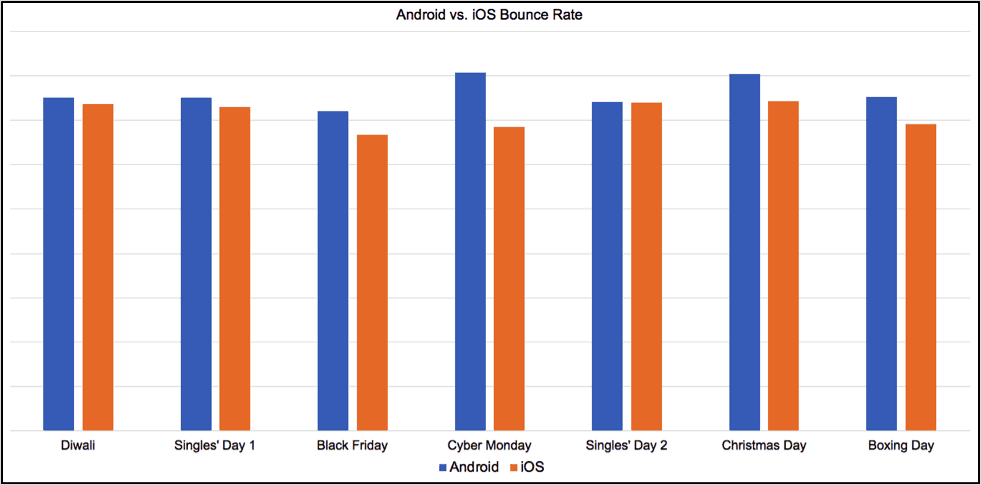
One possible explanation for the higher Android bounce rate, in addition to the issue of sites not being optimized for mobile CX, is that according to the research presented earlier, “Android owners say they’re more frugal and inclined to frequently seek out deals and discounts” which may be reflected in the higher Android bounce rate.
In this post, we’ve examined key web performance trends over the recent holiday season. In the next post, we’ll review key security metrics that Akamai recorded and their implications, and provide critical recommendations for retailers as they prepare for peak traffic in 2019.
Akamai provides content delivery network services to 354 of the Top 1000 online retailers in North America.
Favorite