

Ecommerce Statistics on Specialty Category – Snapshot
SPECIALTY
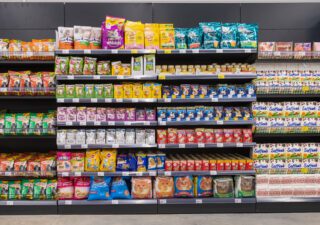
Online Specialty Stores Statistics
 |
 |
Specialty store consumers spent more in 2022
The median conversion rate for specialty retailers dipped slightly from 2021 to 2022, from 3.9% to 3.8%. Median monthly visitors dropped more significantly, from 503,462 to 308,935. That’s nearly a 40% decline year over year. This fits with trends noted by Digital Commerce 360 in other retail categories, as online sales growth slowed and some consumers returned to stores as the pandemic waned.
Customers who did choose to shop online were willing to spend more than in the previous year. Median average ticket grew over the period, from $99 to $120. That’s an increase of more than 20%, significantly outpacing the inflation rate of 6.5% for the year.
 |
Online sales for specialty stores grew by about $2 billion
Online sales from all 76 category retailers in the Top 1000 nearly reached $28 billion in 2022, an increase of about $2 billion from 2021. Those sales made up 17.1% of total combined in-store and online sales in the category. Penetration was down slightly from 18.3% the previous year.
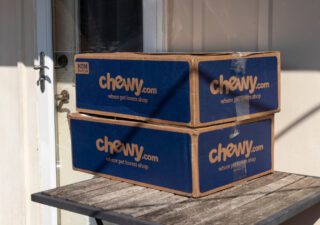
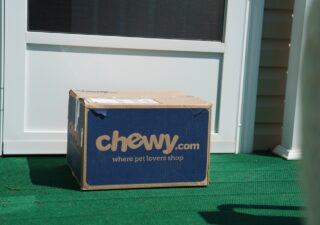
The top five retailers in the category saw some movement from the previous year. The specialty category is wide ranging, encompassing products from pet care to smoking products to medical supplies and books. Two pet retailers made the list this year, with Chewy taking the top spot as sales grew 13.6% in 2022. Two education companies, Follet Higher Educaton and Scholastic Inc, also made the cut. A-Mark Precious Metals Inc. rounds out the list, despite having the only negative sales growth in the top five.
Total sales growth outpaced online sales for specialty products, growing at nearly twice the rate. Total sales grew 15.8% year over year, while online sales grew 7.7%.
 |
 |
Specialty retailer sales grew among older shoppers
Specialty online sales are divided across age demographics, as the category encompasses many types of products. However, the category gained ground with older consumers. Shoppers age 55-64 were responsible for 13.3% of sales in the category, up from 12.2% in 2021. Shoppers 65 and older were responsible for nearly 10% of sales in 2022, up from 7.5% in 2021.
Consumers between the ages of 25 and 44 make up more than 40% of specialty online sales. This age group makes up the bulk of customers at Chewy, the leader in the category.
 |
 |
Source: Digital Commerce 360 1. Digital Commerce 360 analysis of SimilarWeb traffic data. 2. Includes only U.S. sales from the sites of U.S.-owned retailers for consistency with the U.S. Department of Commerce’s methodology. 3. Digital Commerce 360 analysis of U.S. Department of Commerce retail data. 4. Medians won’t sum to 100%.
SPECIALTY CATEGORY NEWS FEED


advertisement


advertisement
advertisement