
Zachary Hudson, product manager, Scalefast
Data is the ultimate double-edged sword for businesses. It has permeated every aspect of the e-commerce industry over the past 10 years—an unescapable tool that, with proper analysis, can take a company to new heights. Unfortunately, data can also grind a company’s productivity to a halt. Countless hours are wasted on building reports that often yield no results. If you’ve worked in e-commerce you’ve likely experienced similar inefficiencies caused by the “Big Data Boom” and the immense pressure it places on companies due to contemporary trends in the marketplace.
According to Google Trends (seen in the graphs below), more and more people are looking to inform themselves of key data terminology including conversion rate optimization (CRO) and key performance indicator (KPI). While it’s great to see businesses take hold of data’s usefulness, it’s worrying to think of all those analysts wasting time on failed reports and shows that this trend isn’t disappearing any time soon.
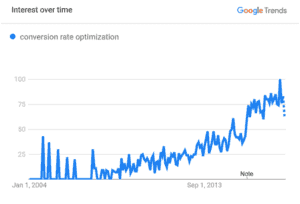
Conversion Rate Optimization interest over time since 2004 reported by Google Trends (Screenshot Taken: February 8th, 2018)
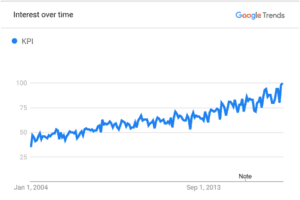
KPI interest over time since 2004 reported by Google Trends. (Screenshot Taken: February 8th, 2018)
If you’re an e-commerce manager or director, you’re likely being pressured increasingly by your bosses and peers to make decisions with data, and for good reason! A quick search reveals an almost endless supply of amazing success stories about the power of data, but deeper analysis reveals the plethora of ways data can be our downfall.
Villain one: Data control
The tools to store and visualize data have greatly outpaced the tools that allow us to effectively act on it. A/B testing, personalized e-commerce, and predictive modeling, to name a few, have just become powerful and cost-effective enough to have an impact in our day to day operations. So how do we keep data from outpacing our ability to act on it?1.
1. Pairing data control with data visualization– This may be a no-brainer for some, but it’s paramount to prepare a sound strategy to act on what data shows before presenting anything to management. Having a solid hypothesis and A/B tests at-the-ready will keep efforts at maximum efficiency and make the data visualization that much more powerful
2. Data control on a budget – The tools required to “control” data can be expensive, and many companies lack the budget to purchase them. Switching to a “Cohort’s Analysis,” a system that groups related users into buckets based on common action taken during a specific period of time and then analyzing the whole bucket rather than the individual, can emulate data control on the cheap.
Here’s an example: If you’re running a subscription program on your site, the January “cohort” would consist of all users who subscribed in January. To continue this Cohort Analysis, you can measure the percentage of users renewing subscriptions in the following months. This allows you to calculate the “Lifetime Value” of subscribers based on which month they signed on and see the impact feature releases have on customers month-to-month.
If your e-commerce business is stuck in a cycle of mass feature deployment and have no clue which feature had an impact, switching to a Cohorts Analysis will help you reap the benefits of better data control.
Villain Two: Human psychology
Here’s a quick anecdote: I was once called into an emergency meeting with an e-commerce client to discuss some troubling findings. Google Analytics was showing a big dip in revenue. Searching for a cause, all signs initially pointed to a major site redesign implemented just weeks before, and, after preparing a series of reports, the bleak data seemed to confirm the worry that this change was a failure. But according to other employees and their own graphs with a far-extended date range, the site redesign was not to blame at all.
Both groups had produced solid evidence “proving” their side of the argument but picking a “winner” in this case is not the point. In hindsight, each set of people were simply searching for data that proved their own points. Daniel Kahneman in his book “Thinking, Fast and Slow” outlines this conundrum by saying “we make our decisions because we have good reasons to make them. Even when it’s the other way around. We believe in the reasons, because we’ve already made the decision.” In other words, it’s incredibly easy to skew data to fit an agenda. Applying the same numbers to different situations will produce vastly different results. Add a bit of written context or a strong verbal argument to the mix and you essentially have the power to bend data into any conclusion you want.
Fixing the Human Psychology’s Weaknesses
1. Rely on a non-biased data analyst– It’s likely impossible to remove all human bias from data. Regardless, it’s imperative to have someone in your organization to rely on for less-skewed data analysis. This person should be separated from the e-commerce team and not directly connected to that team’s goals. Employing this tactic will reduce the likelihood of the e-commerce team intentionally or unintentionally influencing the data analyst to pull data that proves their metrics of success.
2. Standardize and Hypothesize– Even if there’s no budget to hire a data analyst, since they can be prohibitively expensive, strategies do exist to alleviate this issue. If you’re implementing the Cohort’s Analysis mentioned earlier, note that this method can be supplemented by building a system to hypothesize and standardize directly into your e-commerce process. Before building any feature, you must establish a hypothesis within the specs or requirements to state what you thinkwill happen and assign metrics based on your thoughts. Here’s a template to use:
- Situation: Write a description about what situation is currently happening – typically, this is from the user’s perspective.
o Example: The home page fails to load for anyone using an iPhone 8 and the Firefox internet browser.
- Expected Outcome: Develop a list of “deliverables” that should be testable at the end of the project. Use a visual representation of the situation such as a screenshot or graph.
o Example: The home page displays “Critical Error Found” for anyone using an iPhone 8 and the Firefox internet browser. (Use this space to include visual representation of the situation).
- Motivation: Detail your hypothesis, any related metrics and exactly what you’re hoping to change or fix.
o Example: “Firefox mobile users on iPhone 8 account for 1 percent of our monthly traffic. By fixing this we should see a 10 percent increase in conversion rate for users on iPhone 8 using the Firefox browser. This should occur immediately following launch within the first week.”Using this method will make it far more difficult to weasel your way out of a situation with false reporting and bias caused by human psychology. Standardizing this hypothesis-focused template will also help you to make better decisions in the future and significantly reduce employees’ time spend relating to data analysis.
Villain Three: Standardized Time Spend Reporting
Many employees spend far too much time generating reports, drafting cover letters to explain their findings, etc. Finding a way to standardize time spend tracking will help everyone on your team understand when a project is getting away from them—licensing a time tracking application is highly recommended for this reason.
You must also set guidelines for how long certain projects should take. Without these rules, you’ll find team members may start producing unnecessarily long reports, siphoning hours of company time that could be spent elsewhere. Ensure all internal reports are kept to one or two pages (with some exceptions) to decrease the time to produce them and the time to read them.
Avoid building reports with “feel good” metrics such as total revenue, traffic or signups. Ensure employees create actionable metrics and concisely explain each in a way that eliminates time wasted on confusion. If you’re the team leader, go a step further by giving everyone around you access to the reports and data rather than acting like a gatekeeper. Empowering your company with standardized, simple, actionable reports and the ability to access it at any time will help quickly destroy poor time spending.
Final Thoughts
The immediate future should help us streamline our use of data even further as advancements in AI improve our e-commerce data sources and our ability to analyze them. Machine-learning is another key buzz word you’ll be hearing a lot in the coming years, and with good reason as it really stands to revolutionize our industry.
But while none of the above tips are foolproof, implementing at least a few of these strategies will assist with avoiding a bitter downfall at the hands of data as we wait for these new technologies to enter our field. Remember, data can be a fruitful and powerful ally, but it can also be the abused catalyst that pulls your organization apart at the seams.
Based in Los Angeles, with offices in Paris and Madrid, Scalefast provides an e-commerce platform for brands in the entertainment, consumer goods and fashion industries.
Favorite